
![]()
CompTIA DA0-002 Daily Practice Exam New 2025 Updated 113 Questions
Use Valid DA0-002 Exam - Actual Exam Question & Answer
NEW QUESTION # 50
Which of the following is the most efficient to use when programming repeatable tasks?
- A. LLM
- B. RPA
- C. Deep learning
- D. NLP
Answer: B
Explanation:
This question pertains to theData Acquisition and Preparationdomain, focusing on tools for automating repeatable tasks in data processes. The task is to identify the most efficient programming method.
* LLM (Option A): Large Language Models (e.g., GPT) are for text generation, not efficient for repeatable data tasks.
* Deep learning (Option B): Deep learning is for complex pattern recognition (e.g., image classification), not efficient for simple repeatable tasks.
* NLP (Option C): Natural Language Processing is for text analysis, not general repeatable tasks.
* RPA (Option D): Robotic Process Automation (RPA) automates repetitive, rule-based tasks (e.g., data entry, file processing), making it the most efficient for programming repeatable tasks.
The DA0-002 Data Acquisition and Preparation domain includes "executing data manipulation," and RPA is a widely used method for automating repeatable data tasks.
Reference: CompTIA Data+ DA0-002 Draft Exam Objectives, Domain 2.0 Data Acquisition and Preparation.
NEW QUESTION # 51
Which of the following data repositories stores unstructured and structured data?
- A. Data silo
- B. Data mart
- C. Data lake
- D. Data store
Answer: C
Explanation:
This question falls under theData Concepts and Environmentsdomain of CompTIA Data+ DA0-002, which involves understanding different types of data repositories and their characteristics. The task is to identify a repository that can store both unstructured and structured data.
* Data store (Option A): A data store is a general term for any data repository, but it's not specific enough to confirm it stores both unstructured and structured data.
* Data silo (Option B): A data silo is an isolated data repository, often structured, and not typically designed for unstructured data.
* Data mart (Option C): A data mart is a subset of a data warehouse, focused on structured data for specific business areas, not unstructured data.
* Data lake (Option D): A data lake is a centralized repository that stores raw data in its native format, including both structured (e.g., tables) and unstructured (e.g., text, images) data, making it the correct choice.
The DA0-002 Data Concepts and Environments domain includes understanding "different types of databases and data repositories," and a data lake is specifically designed to handle both unstructured and structured data.
Reference: CompTIA Data+ DA0-002 Draft Exam Objectives, Domain 1.0 Data Concepts and Environments.
NEW QUESTION # 52
Which of the following best describes the method used to combine files, software, and libraries for use on various operating systems and environments?
- A. Containerization
- B. Code repository
- C. Virtual machine
- D. Package manager
Answer: A
Explanation:
This question pertains to theData Concepts and Environmentsdomain, focusing on methods for managing software and data environments. The task is to identify a method that combines files, software, and libraries for use across different systems.
* Package manager (Option A): Package managers (e.g., npm) manage software dependencies but don't combine files and libraries for cross-system use.
* Code repository (Option B): Code repositories (e.g., GitHub) store code but don't package it for deployment across environments.
* Virtual machine (Option C): Virtual machines emulate entire operating systems, which is heavier than needed for combining files and libraries.
* Containerization (Option D): Containerization (e.g., Docker) packages files, software, and libraries into a container that can run consistently across different operating systems and environments, making it the best choice.
The DA0-002 Data Concepts and Environments domain includes understanding "data environments," and containerization is a standard method for ensuring consistency across systems.
Reference: CompTIA Data+ DA0-002 Draft Exam Objectives, Domain 1.0 Data Concepts and Environments.
NEW QUESTION # 53
A report triggers an error that prevents information from being displayed. However, the report was functional before a database upgrade. Which of the following should a data analyst do first to troubleshoot the problem?
- A. Check whether the data structures were modified.
- B. Ensure the system has permissions for the report service.
- C. Change the report's refresh rate.
- D. Verify the connection to the database.
Answer: D
Explanation:
This question falls under theData Concepts and Environmentsdomain, which in DA0-002 involves understanding database environments, connections, and troubleshooting issues related to data access. The scenario describes a report failing after a database upgrade, indicating a potential issue with the database environment or connectivity.
* Ensure the system has permissions for the report service (Option A): While permissions issues can cause report failures, they are less likely to be the first issue after a database upgrade unless explicitly mentioned.
* Change the report's refresh rate (Option B): Refresh rate adjustments might address performance issues but won't resolve a fundamental error preventing data display.
* Verify the connection to the database (Option C): A database upgrade often involves changes to connection strings, drivers, or network configurations. Verifying the connection ensures the report can access the database, making this the most logical first step.
* Check whether the data structures were modified (Option D): While possible, checking data structures (e.g., schema changes) is a deeper troubleshooting step that should follow after confirming basic connectivity.
The DA0-002 Data Concepts and Environments domain includes understanding database connectivity, similar to DA0-001's focus on "data schemas and dimensions" and environments (web ID: 1). Verifying the connection is the first recommended step in troubleshooting post-upgrade issues.
Reference: CompTIA Data+ DA0-002 Draft Exam Objectives, Domain 1.0 Data Concepts and Environments
NEW QUESTION # 54
An analyst must use the same data to create reports for police patrol supervisors, the city council, and a public website. Which of the following is the best way to differentiate the reports?
- A. Sensitivity
- B. Detail levels
- C. Accessibility
- D. Persona type
Answer: D
Explanation:
This question falls under theVisualization and Reportingdomain, focusing on tailoring reports for different audiences. The same data is used for three distinct groups (supervisors, city council, public), requiring differentiation.
* Persona type (Option A): Persona types define the audience's needs and preferences (e.g., supervisors need operational details, the city council needs summaries, the public needs simplified data), making this the best way to differentiate the reports.
* Detail levels (Option B): Detail levels are a result of persona types, not the method of differentiation.
* Accessibility (Option C): Accessibility ensures access for all users (e.g., screen readers), but it's not the primary way to differentiate content.
* Sensitivity (Option D): Sensitivity determines data access (e.g., confidential vs. public), but the scenario implies all reports use the same data, just presented differently.
The DA0-002 Visualization and Reporting domain emphasizes "translating business requirements to form the appropriate visualization," and persona types guide report differentiation for diverse audiences.
Reference: CompTIA Data+ DA0-002 Draft Exam Objectives, Domain 4.0 Visualization and Reporting.
NEW QUESTION # 55
A data analyst troubleshoots a dashboard every day for a week. Which of the following techniques best addresses how to validate the data moving forward?
- A. Setting up monitoring alerts
- B. Rebuilding the dashboard
- C. Inquiring about structure changes
- D. Reaching out to users daily
Answer: A
Explanation:
This question pertains to theData Governancedomain, focusing on ensuring data quality and reliability in dashboards over time. Daily troubleshooting indicates a recurring issue, and the task is to validate data moving forward.
* Inquiring about structure changes (Option A): This might identify past issues but doesn't provide ongoing validation.
* Setting up monitoring alerts (Option B): Monitoring alerts can automatically notify the analyst of data issues (e.g., missing updates, errors), providing a proactive way to validate data continuously.
* Reaching out to users daily (Option C): This is inefficient and reactive, not a sustainable validation method.
* Rebuilding the dashboard (Option D): Rebuilding might fix current issues but doesn't ensure future validation.
The DA0-002 Data Governance domain includes "data quality control concepts," such as implementing monitoring to ensure data reliability in dashboards.
Reference: CompTIA Data+ DA0-002 Draft Exam Objectives, Domain 5.0 Data Governance.
NEW QUESTION # 56
An analyst is building a reporting deck. The deck must include tracking and visualizing metrics and row-level security. Which of the following actions should the analyst take after meeting all of the requirements?
- A. Present an analysis of the data.
- B. Show a mock-up to the team.
- C. Explain the desired level of reporting detail.
- D. Find out the project due date.
Answer: B
Explanation:
This question pertains to theVisualization and Reportingdomain, focusing on the process of building a reporting deck. After meeting requirements (tracking metrics, visualizing data, and row-level security), the next step involves validation with stakeholders.
* Show a mock-up to the team (Option A): Creating a mock-up and presenting it to the team ensures alignment on design and functionality before finalizing, which is a standard next step in report development.
* Explain the desired level of reporting detail (Option B): This should have been done earlier during requirements gathering, not after meeting them.
* Present an analysis of the data (Option C): Data analysis might inform the deck, but the task focuses on building the deck, not presenting analysis.
* Find out the project due date (Option D): The due date should have been established earlier in the project planning phase.
The DA0-002 Visualization and Reporting domain includes "translating business requirements to form the appropriate visualization," and showing a mock-up ensures the reporting deck meets stakeholder expectations.
Reference: CompTIA Data+ DA0-002 Draft Exam Objectives, Domain 4.0 Visualization and Reporting.
NEW QUESTION # 57
Which of the following best describes the semi-structured data that is gathered when web scraping?
- A. JSON
- B. CSS
- C. HTML
- D. CSV
Answer: A
Explanation:
This question pertains to theData Acquisition and Preparationdomain, which in DA0-002 includes understanding data acquisition concepts and the types of data gathered from varioussources, such as web scraping. Web scraping involves extracting data from websites, and the data gathered is often semi-structured, meaning it has some organizational structure but isn't fully relational like a database table.
* JSON (Option A): JSON (JavaScript Object Notation) is a semi-structured data format commonly used in web applications. Web scraping often retrieves data in JSON format via APIs or embedded scripts, as it's lightweight and structured with key-value pairs, making it ideal for semi-structured data.
* CSV (Option B): CSV (Comma-Separated Values) is a structured format typically used for tabular data. It's not commonly the direct output of web scraping, though scraped data might be converted to CSV later.
* CSS (Option C): CSS (Cascading Style Sheets) is used for styling web pages and isn't a data format, making it irrelevant for describing scraped data.
* HTML (Option D): HTML (HyperText Markup Language) is the structure of web pages and is often the raw format scraped during web scraping. While HTML is semi-structured due to its tag-based hierarchy, it's primarily a markup language, not a data format, and the actual data extracted is often parsed into formats like JSON.
The DA0-002 Data Acquisition and Preparation domain aligns with the DA0-001 focus on "data acquisition concepts" (web ID: 14), which includes identifying formats like JSON as semi-structured data commonly acquired through web scraping. JSON is the best fit here due to its prevalence in web data exchange.
Reference: CompTIA Data+ DA0-002 Draft Exam Objectives, Domain 2.0 Data Acquisition and Preparation
NEW QUESTION # 58
A table contains several rows of cellular numbers with call timestamps, call durations, called numbers, and carriers of the called number. Which of the following allows a data analyst to sort the cellular numbers based on the carriers of the called numbers and include the total call durations?
- A. SELECT cellular_number, called_number_carrier, SUM(call_duration) FROM calls GROUP BY cellular_number, called_number_carrier ORDER BY called_number_carrier;
- B. SELECT cellular_number, called_number_carrier, SUM(call_duration) FROM calls GROUP BY call_duration ORDER BY called_number_carrier;
- C. SELECT cellular_number, SUM(call_duration) FROM calls GROUP BY call_duration ORDERBY called_number_carrier;
- D. SELECT cellular_number, called_number_carrier, SUM(call_duration) FROM calls GROUP BY cellular_number ORDER BY called_number_carrier;
Answer: A
Explanation:
This question falls under theData Analysisdomain of CompTIA Data+ DA0-002, focusing on SQL queries for data analysis. The task requires sorting cellular numbers by the carrier of the called number (called_number_carrier) and calculating the total call durations (SUM(call_duration)).
* Option A: SELECT cellular_number, called_number_carrier, SUM(call_duration) FROM calls GROUP BY cellular_number ORDER BY called_number_carrierThis query groups by cellular_number only, but called_number_carrier is in the SELECT clause without being in the GROUP BY, which is invalid in SQL (it would raise an error in most databases).
* Option B: SELECT cellular_number, SUM(call_duration) FROM calls GROUP BY call_duration ORDER BY called_number_carrierThis query doesn't include called_number_carrier in the SELECT clause, so it cannot be used in the ORDER BY clause, making it invalid. Grouping by call_duration also doesn't align with the task.
* Option C: SELECT cellular_number, called_number_carrier, SUM(call_duration) FROM calls GROUP BY cellular_number, called_number_carrier ORDER BY called_number_carrierThis query correctly groups by both cellular_number and called_number_carrier (since both are in the SELECT clause), calculates the total call duration with SUM(call_duration), and sorts by called_number_carrier as required.
* Option D: SELECT cellular_number, called_number_carrier, SUM(call_duration) FROM calls GROUP BY call_duration ORDER BY called_number_carrierGrouping by call_duration is incorrect because cellular_number and called_number_carrier are in the SELECT clause but not in the GROUP BY, making this query invalid.
The DA0-002 Data Analysis domain includes "applying the appropriate descriptive statistical methods using SQL queries," and Option C correctly aggregates and sorts the data as specified.
Reference: CompTIA Data+ DA0-002 Draft Exam Objectives, Domain 3.0 Data Analysis.
NEW QUESTION # 59
A database administrator needs to implement security triggers for an organization's user information database.
Which of the following data classifications is the administrator most likely using? (Select two).
- A. Non-Sensitive
- B. Private
- C. Open
- D. Encrypted
- E. Sensitive
- F. Public
Answer: B,E
Explanation:
This question pertains to theData Governancedomain, focusing on data classification for security purposes.
User information databases typically contain personal data, and security triggers (e.g., alerts for unauthorized access) require classifying data to determine protection levels.
* Public (Option A): Public data is openly accessible (e.g., company brochures), not suitable for user information requiring security triggers.
* Open (Option B): Open isn't a standard data classification; it's similar to public and not applicable here.
* Sensitive (Option C): Sensitive data includes information that, if exposed, could cause harm (e.g., user emails, roles), which fits user information and warrants security triggers.
* Non-Sensitive (Option D): Non-sensitive data doesn't require protection, so it wouldn't need security triggers.
* Private (Option E): Private data includes PII (e.g., names, addresses) in user information databases, requiring security measures like triggers to protect against breaches.
* Encrypted (Option F): Encrypted refers to a data state, not a classification; data can be classified as private or sensitive and then encrypted.
The DA0-002 Data Governance domain includes "data quality control concepts," such as classifying data to apply appropriate security measures. Sensitive and private classifications are most relevant for user information.
Reference: CompTIA Data+ DA0-002 Draft Exam Objectives, Domain 5.0 Data Governance.
NEW QUESTION # 60
A data breach occurs at a company. Which of the following actions should be taken?
- A. Keep the incident a secret until the issue is resolved.
- B. Inform the entire IT sector, but ask for discretion.
- C. Tell the company management team and then tell regulatory agencies.
- D. Make an announcement on social media so customers are aware as soon as possible.
Answer: C
Explanation:
This question falls under theData Governancedomain, focusing on data breach response protocols. A data breach requires a structured response to comply with legal and regulatory requirements.
* Make an announcement on social media so customers are aware as soon as possible (Option A):
Public announcement without internal coordination or regulatory notificationcan lead to legal issues and loss of trust.
* Tell the company management team and then tell regulatory agencies (Option B): This follows best practices: inform internal leadership to coordinate a response, then notify regulatory agencies as required by laws (e.g., GDPR mandates notification within 72 hours).
* Keep the incident a secret until the issue is resolved (Option C): This violates regulations requiring timely breach notification.
* Inform the entire IT sector, but ask for discretion (Option D): Sharing with the IT sector is vague and risks leaks; regulatory agencies should be prioritized.
The DA0-002 Data Governance domain includes "data privacy concepts," such as proper breach response procedures, emphasizing internal and regulatory notification.
Reference: CompTIA Data+ DA0-002 Draft Exam Objectives, Domain 5.0 Data Governance.
NEW QUESTION # 61
The director of operations at a power company needs data to help identify where company resources should be allocated in order to monitor activity for outages and restoration of power in the entire state. Specifically, the director wants to see the following:
* County outages
* Status
* Overall trend of outages
INSTRUCTIONS:
Please, select each visualization to fit the appropriate space on the dashboard and choose an appropriate color scheme. Once you have selected all visualizations, please, select the appropriate titles and labels, if applicable.
Titles and labels may be used more than once.
If at any time you would like to bring back the initial state of the simulation, please click the Reset All button.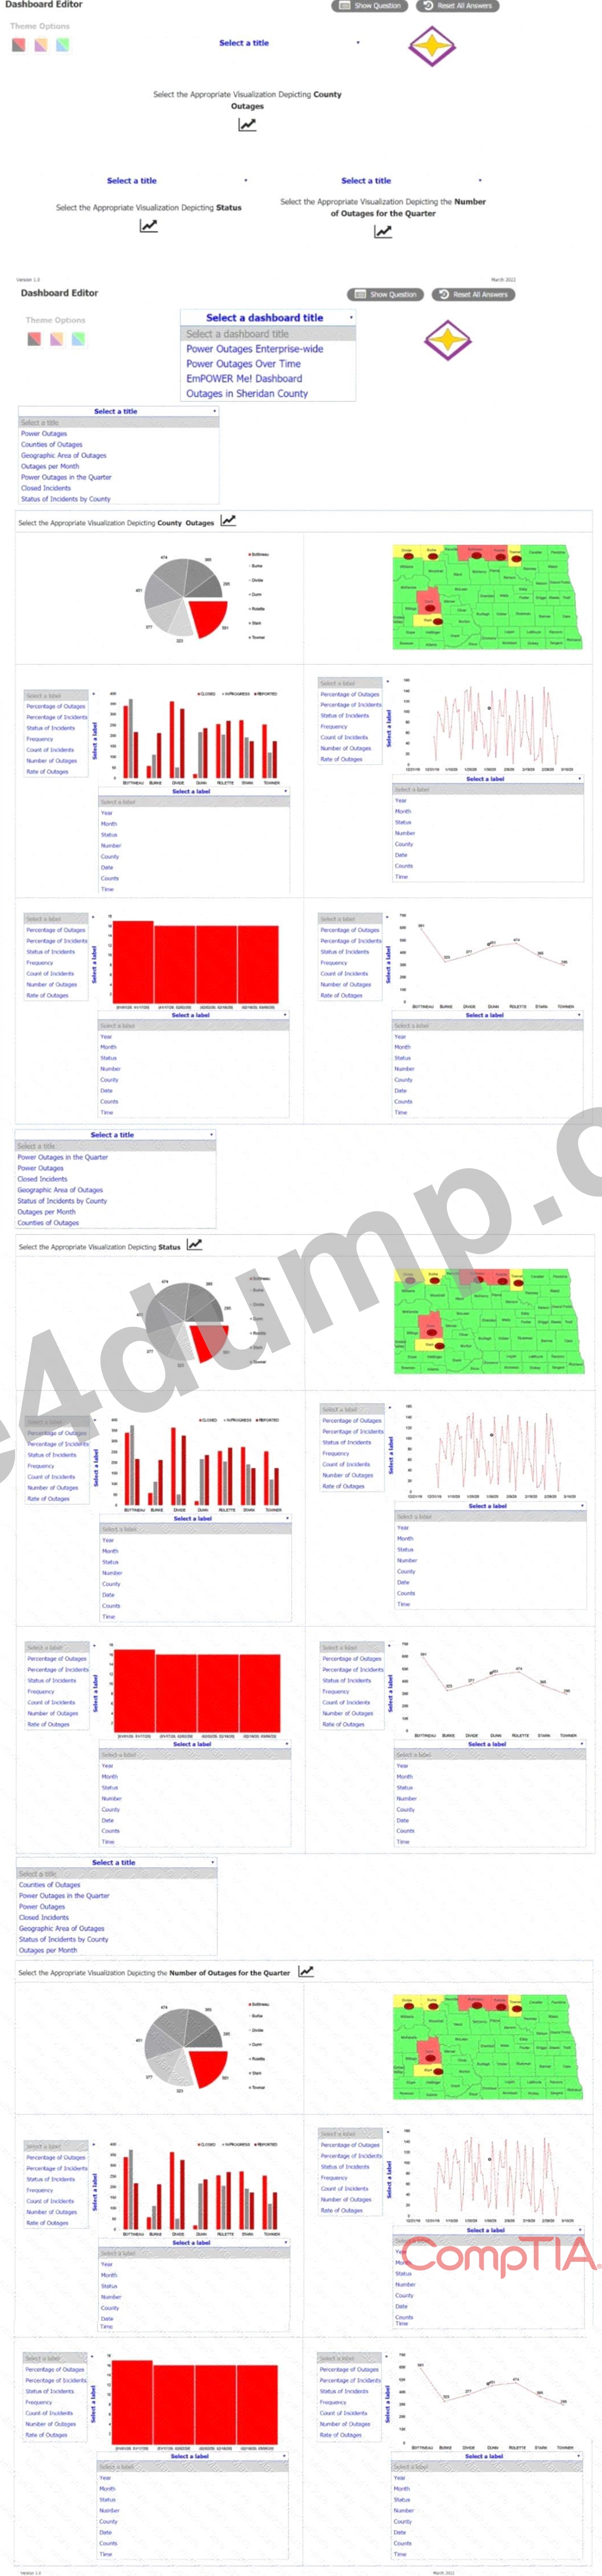
Answer:
Explanation:
Power outages
Explanation:
This is a simulation question that requires you to create a dashboard with visualizations that meet the director' s needs.Here are the steps to complete the task:
* Drag and drop the visualization that shows the county outages on the top left space of the dashboard.
This visualization is a map of the state with different colors indicating the number of outages in each county. You can choose any color scheme that suits your preference, but make sure that the colors are consistent and clear. For example, you can use a gradient of red to show the counties with more outages and green to show the counties with less outages.
* Drag and drop the visualization that shows the status of the outages on the top right space of the dashboard. This visualization is a pie chart that shows the percentage of outages that are active, restored, or pending. You can choose any color scheme that suits your preference, but make sure that the colors are distinct and easy to identify. For example, you can use red for active, green for restored, and yellow for pending.
* Drag and drop the visualization that shows the overall trend of outages on the bottom space of the dashboard. This visualization is a line graph that shows the number of outages over time. You can choose any color scheme that suits your preference, but make sure that the color is visible and contrasted with the background. For example, you can use blue for the line and white for the background.
* Select appropriate titles and labels for each visualization. Titles and labels may be used more than once.
For example, you can use "County Outages" as the title for the map, "Status" as the title for the pie chart, and "Trend" as the title for the line graph. You can also use "County", "Number of Outages",
"Active", "Restored", "Pending", "Time", and "Number of Outages" as labels for the axes and legends of the visualizations.
NEW QUESTION # 62
A data analyst needs to provide a weekly sales report for the Chief Financial Officer. Which of the following delivery methods is the most appropriate?
- A. A spreadsheet with raw data
- B. A granular daily report in a dashboard
- C. A high-level email
- D. A detailed text document
Answer: C
Explanation:
This question pertains to theVisualization and Reportingdomain, focusing on report delivery methods for a specific audience. The Chief Financial Officer (CFO) needs a weekly sales report,suggesting a concise, executive-level summary.
* A granular daily report in a dashboard (Option A): Daily granularity is too frequent for a weekly report, and a dashboard might be too interactive for a CFO's needs.
* A detailed text document (Option B): A detailed document is too lengthy for a CFO, who typically needs a summary.
* A spreadsheet with raw data (Option C): Raw data requires further analysis, which isn't appropriate for an executive-level report.
* A high-level email (Option D): A high-level email provides a concise summary of weekly sales, tailored for an executive like a CFO, making it the most appropriate delivery method.
The DA0-002 Visualization and Reporting domain emphasizes "translating business requirements to form the appropriate visualization," and a high-level email is best for delivering a weekly summary to a CFO.
Reference: CompTIA Data+ DA0-002 Draft Exam Objectives, Domain 4.0 Visualization and Reporting.
NEW QUESTION # 63
The human resources department wants to know the number of employees who earn $125,000 or more.
However, the department is concerned about duplicates in the dataset. Given the following table:
Employee_ID
Level
Salary
001
1
10000
002
2
20000
003
2
256000
004
2
125000
001
1
10000
002
2
20000
Which of the following SQL statements resolves this issue?
- A. SELECT DISTINCT Employee_ID FROM Employee WHERE Salary > 125000
- B. SELECT COUNT(Employee_ID) FROM Employee WHERE Salary >= 125000
- C. SELECT COUNT(DISTINCT Employee_ID) FROM Employee WHERE Salary >= 125000
- D. SELECT DISTINCT Employee_ID FROM Employee WHERE Salary >= 125000
Answer: C
Explanation:
This question falls under theData Analysisdomain, focusing on SQL queries to handle duplicates while counting employees. The task is to count unique employees with a salary of $125,000 or more, addressing duplicates in the dataset.
* Option A: SELECT DISTINCT Employee_ID FROM Employee WHERE Salary >= 125000This lists unique Employee_IDs but doesn't provide a count, which the department needs.
* Option B: SELECT COUNT(DISTINCT Employee_ID) FROM Employee WHERE Salary >=
125000This counts unique Employee_IDs (using DISTINCT) with a salary of $125,000 or more, correctly addressing duplicates and providing the required count (2 employees: 003 and 004).
* Option C: SELECT DISTINCT Employee_ID FROM Employee WHERE Salary > 125000This lists unique Employee_IDs with a salary strictly greater than $125,000 (missing 004), and doesn't provide a count.
* Option D: SELECT COUNT(Employee_ID) FROM Employee WHERE Salary >= 125000This counts all rows without addressing duplicates, resulting in an incorrect count (2 rows, but only 2 unique employees).
The DA0-002 Data Analysis domain includes "applying the appropriate descriptive statistical methods using SQL queries," and COUNT(DISTINCT) is the correct method to count unique employees while handling duplicates.
Reference: CompTIA Data+ DA0-002 Draft Exam Objectives, Domain 3.0 Data Analysis.
NEW QUESTION # 64
The sales department wants to include the composition of total sales amounts across all three sales channels in a report. Given the following sample sales table:
Sales channel
Month
Sales (million $)
Digital
January
135
Store
February
145
Online
March
165
Store
April
200
Store
May
125
Online
June
155
Digital
July
120
Online
August
145
Digital
September
160
Which of the following visualizations is the most appropriate?
- A. Pie chart
- B. Pivot table
- C. KPI card
- D. Box plot
Answer: A
Explanation:
This question pertains to theVisualization and Reportingdomain, focusing on selecting the appropriate visualization for a specific requirement. The task is to show the composition of total sales across three channels, which involves showing proportions.
* Pivot table (Option A): A pivot table summarizes data but isn't a visualization; it's more for data exploration.
* Pie chart (Option B): A pie chart shows the proportion of total sales for each channel (Digital, Store, Online), which is ideal for displaying composition.
* KPI card (Option C): A KPI card displays a single metric, not suitable for showing composition across multiple channels.
* Box plot (Option D): A box plot shows data distribution (e.g., quartiles), not proportions.
The DA0-002 Visualization and Reporting domain emphasizes "translating business requirements to form the appropriate visualization," and a pie chart is best for showing the composition of totals.
Reference: CompTIA Data+ DA0-002 Draft Exam Objectives, Domain 4.0 Visualization and Reporting.
NEW QUESTION # 65
A company's entire server environment is located at the company's headquarters. Which of the following describes this type of environment?
- A. On-premises
- B. Public
- C. Hybrid
- D. Cloud
Answer: A
Explanation:
This question pertains to theData Concepts and Environmentsdomain, focusing on types of server environments. The servers are located at the company's headquarters, indicating a specific deployment model.
* Cloud (Option A): Cloud environments are hosted off-site by third-party providers, not at headquarters.
* On-premises (Option B): On-premises environments are located at the company's physical location (e.
g., headquarters), which matches the scenario.
* Public (Option C): Public environments are cloud-based and shared across multiple organizations, not located at headquarters.
* Hybrid (Option D): Hybrid environments combine on-premises and cloud, but the scenario specifies all servers are at headquarters.
The DA0-002 Data Concepts and Environments domain includes understanding "data environments," and on- premises describes a server environment located at the company's site.
Reference: CompTIA Data+ DA0-002 Draft Exam Objectives, Domain 1.0 Data Concepts and Environments.
NEW QUESTION # 66
Which of the following data repositories stores unaltered data?
- A. Data warehouse
- B. Data lake
- C. Data table
- D. Data factory
Answer: B
Explanation:
This question falls under theData Concepts and Environmentsdomain, focusing on data repositories. The task is to identify a repository that stores data in its original, unaltered form.
* Data lake (Option A): A data lake stores raw, unaltered data in its native format (structured, semi- structured, or unstructured), making it the correct choice.
* Data warehouse (Option B): A data warehouse stores processed, structured data, often transformed for analysis, not unaltered.
* Data table (Option C): A data table is a structure within a database, not a repository, and may contain altered data.
* Data factory (Option D): A data factory (e.g., Azure Data Factory) is a data integration service, not a repository for storing data.
The DA0-002 Data Concepts and Environments domain includes understanding "different types of databases and data repositories," and a data lake is designed to store unaltered data.
Reference: CompTIA Data+ DA0-002 Draft Exam Objectives, Domain 1.0 Data Concepts and Environments.
NEW QUESTION # 67
Which of the following is business intelligence software?
- A. Notepad++
- B. SAS
- C. Tableau
- D. Python
Answer: C
Explanation:
This question falls under theVisualization and Reportingdomain, focusing on identifying tools used for business intelligence (BI), which typically involves data visualization and reporting.
* SAS (Option A): SAS is a statistical analysis software, not primarily a BI tool focused on visualization.
* Python (Option B): Python is a programming language, not a BI software, though it can be used for data analysis with libraries.
* Notepad++ (Option C): Notepad++ is a text editor, not a BI tool.
* Tableau (Option D): Tableau is a leading BI software designed for data visualization, dashboards, and reporting, making it the correct choice.
The DA0-002 Visualization and Reporting domain includes understanding "the appropriate visualization in the form of a report or dashboard," and Tableau is a recognized BI tool for this purpose.
Reference: CompTIA Data+ DA0-002 Draft Exam Objectives, Domain 4.0 Visualization and Reporting.
NEW QUESTION # 68
A data analyst encounters an issue with new software and a code that they are using. The analyst includes print statements in the code to try to identify the issue, without success. An informal peer review of the code also produces the same result. The analyst confirms that the software is updated to the latest version and compatible with the code. Which of the following troubleshooting steps should the analyst take next?
- A. Use the old software and preexisting code, since both were functional.
- B. Research the issue online and see if a solution is available.
- C. Escalate to the department manager and ask for assistance.
- D. Contact the IT department and inform them that the software has a bug.
Answer: B
Explanation:
This question pertains to theData Governancedomain, focusing on troubleshooting andmaintaining data quality in software processes. The analyst has already tried basic debugging and confirmed compatibility, so the next step involves seeking external resources.
* Use the old software and preexisting code, since both were functional (Option A): Reverting to old software avoids solving the issue and may introduce other risks (e.g., security vulnerabilities).
* Contact the IT department and inform them that the software has a bug (Option B): Assuming a bug without further investigation is premature, especially since compatibility was confirmed.
* Escalate to the department manager and ask for assistance (Option C): Escalation is a later step after exhausting technical troubleshooting options.
* Research the issue online and see if a solution is available (Option D): Researching online (e.g., forums, documentation) is a logical next step to find solutions or identify known issues, especially after local debugging fails.
The DA0-002 Data Governance domain includes "data quality control concepts," and researching online is a standard troubleshooting step to maintain data process integrity.
Reference: CompTIA Data+ DA0-002 Draft Exam Objectives, Domain 5.0 Data Governance.
NEW QUESTION # 69
A data analyst needs to join together a table data source and a web API data source using Python. Which of the following is the best way to accomplish this task?
- A. Convert the data from the API and database to a TXT format and convert them to pandas DataFrames that are then merged together.
- B. Convert the data from the API and database to a varchar format and convert them to pandas DataFrames that are then merged together.
- C. Convert the data from the API and database to a string format and convert them to pandas DataFrames that are then merged together.
- D. Convert the data from the API and database to a JSON format and convert them to pandas DataFrames that are then merged together.
Answer: D
Explanation:
This question falls under theData Acquisition and Preparationdomain of CompTIA Data+ DA0-002, which involves acquiring and combining data from different sources, such as a database and a web API, using tools like Python. The task requires joining the data, which in Python often involves using pandas DataFrames.
* Convert the data from the API and database to a varchar format and convert them to pandas DataFrames that are then merged together (Option A): VARCHAR is a databasedata type for strings, not a format for data exchange or merging in Python, making this incorrect.
* Convert the data from the API and database to a JSON format and convert them to pandas DataFrames that are then merged together (Option B): Web APIs commonly return data in JSON format, and databases can export data as JSON. In Python, JSON data can be easily converted to pandas DataFrames using pandas.read_json() or pandas.DataFrame(), and then merged using pandas.merge() on a common key, making this the best approach.
* Convert the data from the API and database to a TXT format and convert them to pandas DataFrames that are then merged together (Option C): TXT is a generic text format that lacks structure, making it less efficient for merging compared to JSON.
* Convert the data from the API and database to a string format and convert them to pandas DataFrames that are then merged together (Option D): Converting to a string format is vague and not a standard approach for structured data merging in Python.
The DA0-002 Data Acquisition and Preparation domain includes "executing data manipulation," such as combining data from APIs and databases, and JSON is a standard format for this purpose in Python.
Reference: CompTIA Data+ DA0-002 Draft Exam Objectives, Domain 2.0 Data Acquisition and Preparation.
NEW QUESTION # 70
A data analyst needs to remove all duplicate values between two tables, "Employees" and "Managers," using SQL SELECT statements. Which of the following should the analyst use for this task?
- A. SELECT * FROM Employees UNION ALL SELECT * FROM Managers
- B. SELECT * FROM Employees UNION SELECT * FROM Managers
- C. SELECT * FROM Employees JOIN SELECT * FROM Managers
- D. SELECT * FROM Employees CROSS JOIN SELECT * FROM Managers
Answer: B
Explanation:
This question pertains to theData Acquisition and Preparationdomain, focusing on combining and deduplicating data using SQL. The task is to remove duplicates between two tables, meaning the analyst needs a unique set of records from both.
* SELECT * FROM Employees UNION ALL SELECT * FROM Managers (Option A): UNION ALL combines all rows from both tables, including duplicates, which doesn't meet the requirement.
* SELECT * FROM Employees UNION SELECT * FROM Managers (Option B): UNION combines rows from both tables and automatically removes duplicates, providing a unique set of records, which fits the task.
* SELECT * FROM Employees JOIN SELECT * FROM Managers (Option C): This syntax is incorrect; a JOIN requires an ON clause, and it wouldn't remove duplicates.
* SELECT * FROM Employees CROSS JOIN SELECT * FROM Managers (Option D): A CROSS JOIN creates a Cartesian product, resulting in all possible combinations, not removing duplicates.
The DA0-002 Data Acquisition and Preparation domain includes "executing data manipulation," and UNION is the correct SQL operation for combining tables while removing duplicates.
Reference: CompTIA Data+ DA0-002 Draft Exam Objectives, Domain 2.0 Data Acquisition and Preparation.
NEW QUESTION # 71
The human resources department wants to understand the relationship between the ages and incomes of all employees. Which of the following graphics is the most appropriate to present the analysis?
- A. Pie chart
- B. Area plot
- C. Scatter plot
- D. Bar chart
Answer: C
Explanation:
This question pertains to theVisualization and Reportingdomain, focusing on selecting the appropriate visualization to show a relationship between two continuous variables (ages and incomes).
* Scatter plot (Option A): A scatter plot displays individual data points on two axes (age vs. income), making it ideal for showing the relationship and potential correlation between two continuous variables.
* Area plot (Option B): Area plots are used for showing trends over time, not relationships between two variables.
* Bar chart (Option C): Bar charts are better for categorical data comparisons, not continuous variable relationships.
* Pie chart (Option D): Pie charts show proportions of a whole, not suitable for showing relationships between variables.
The DA0-002 Visualization and Reporting domain emphasizes "translating business requirements to form the appropriate visualization," and a scatter plot is best for showing the relationship between age and income.
Reference: CompTIA Data+ DA0-002 Draft Exam Objectives, Domain 4.0 Visualization and Reporting.
NEW QUESTION # 72
......
Test Engine to Practice DA0-002 Test Questions: https://passleader.free4dump.com/DA0-002-real-dump.html